In response to the climate challenge, GRTgaz has adopted ambitious carbon targets for its own needs and those of the gas industry, aiming to keep to a carbon trajectory well below 2°C, compatible with the Paris Agreement and the national low-carbon strategy for emis-sions within its manageable scopes.

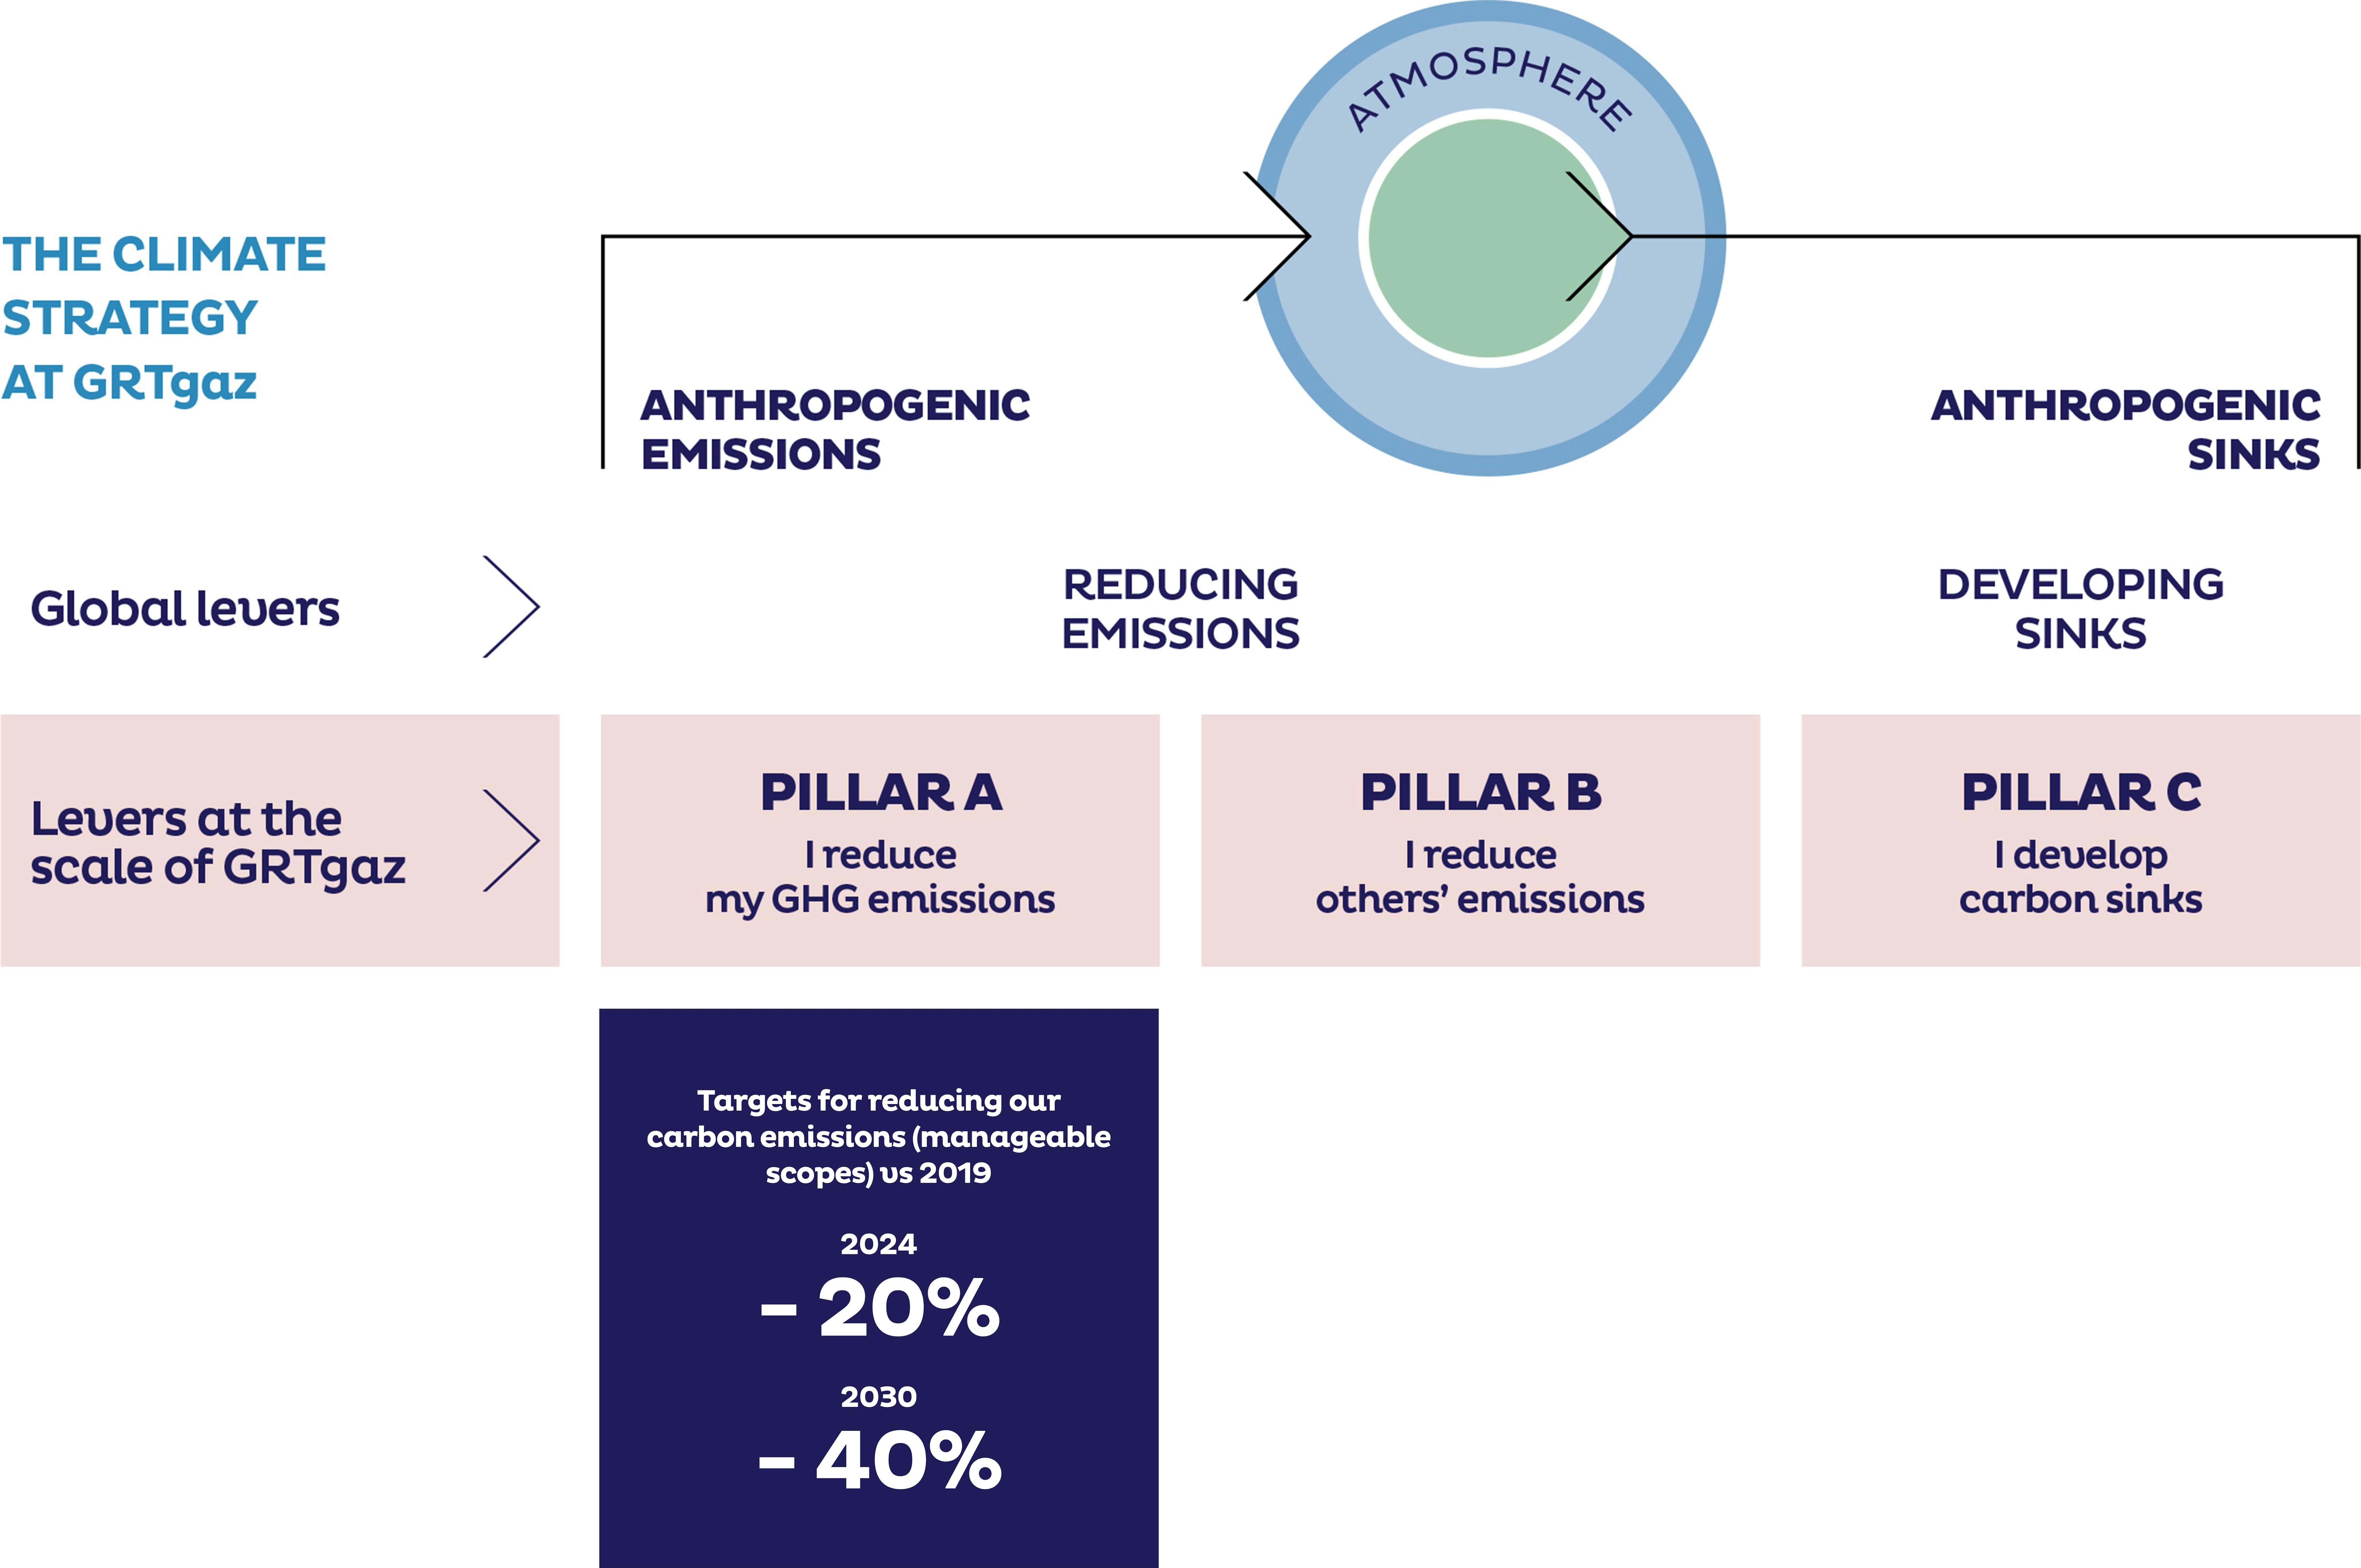
This diagram shows the climate strategy at GRTgaz.
- Anthropogenic emissions
- Anthropogenic sinks
Global levers:
- Reducing emissions
- Developing sinks
Levers at the scale of GRTgaz:
- Pillar A - I reduce my GHG emissions
- Pillar B - I reduce other’s emissions
- Pillar C - I develop carbon sinks
Targets for reducing our carbon emissions (manageable scopes) vs 2019
- 2024: -20%
- 2030: -40%
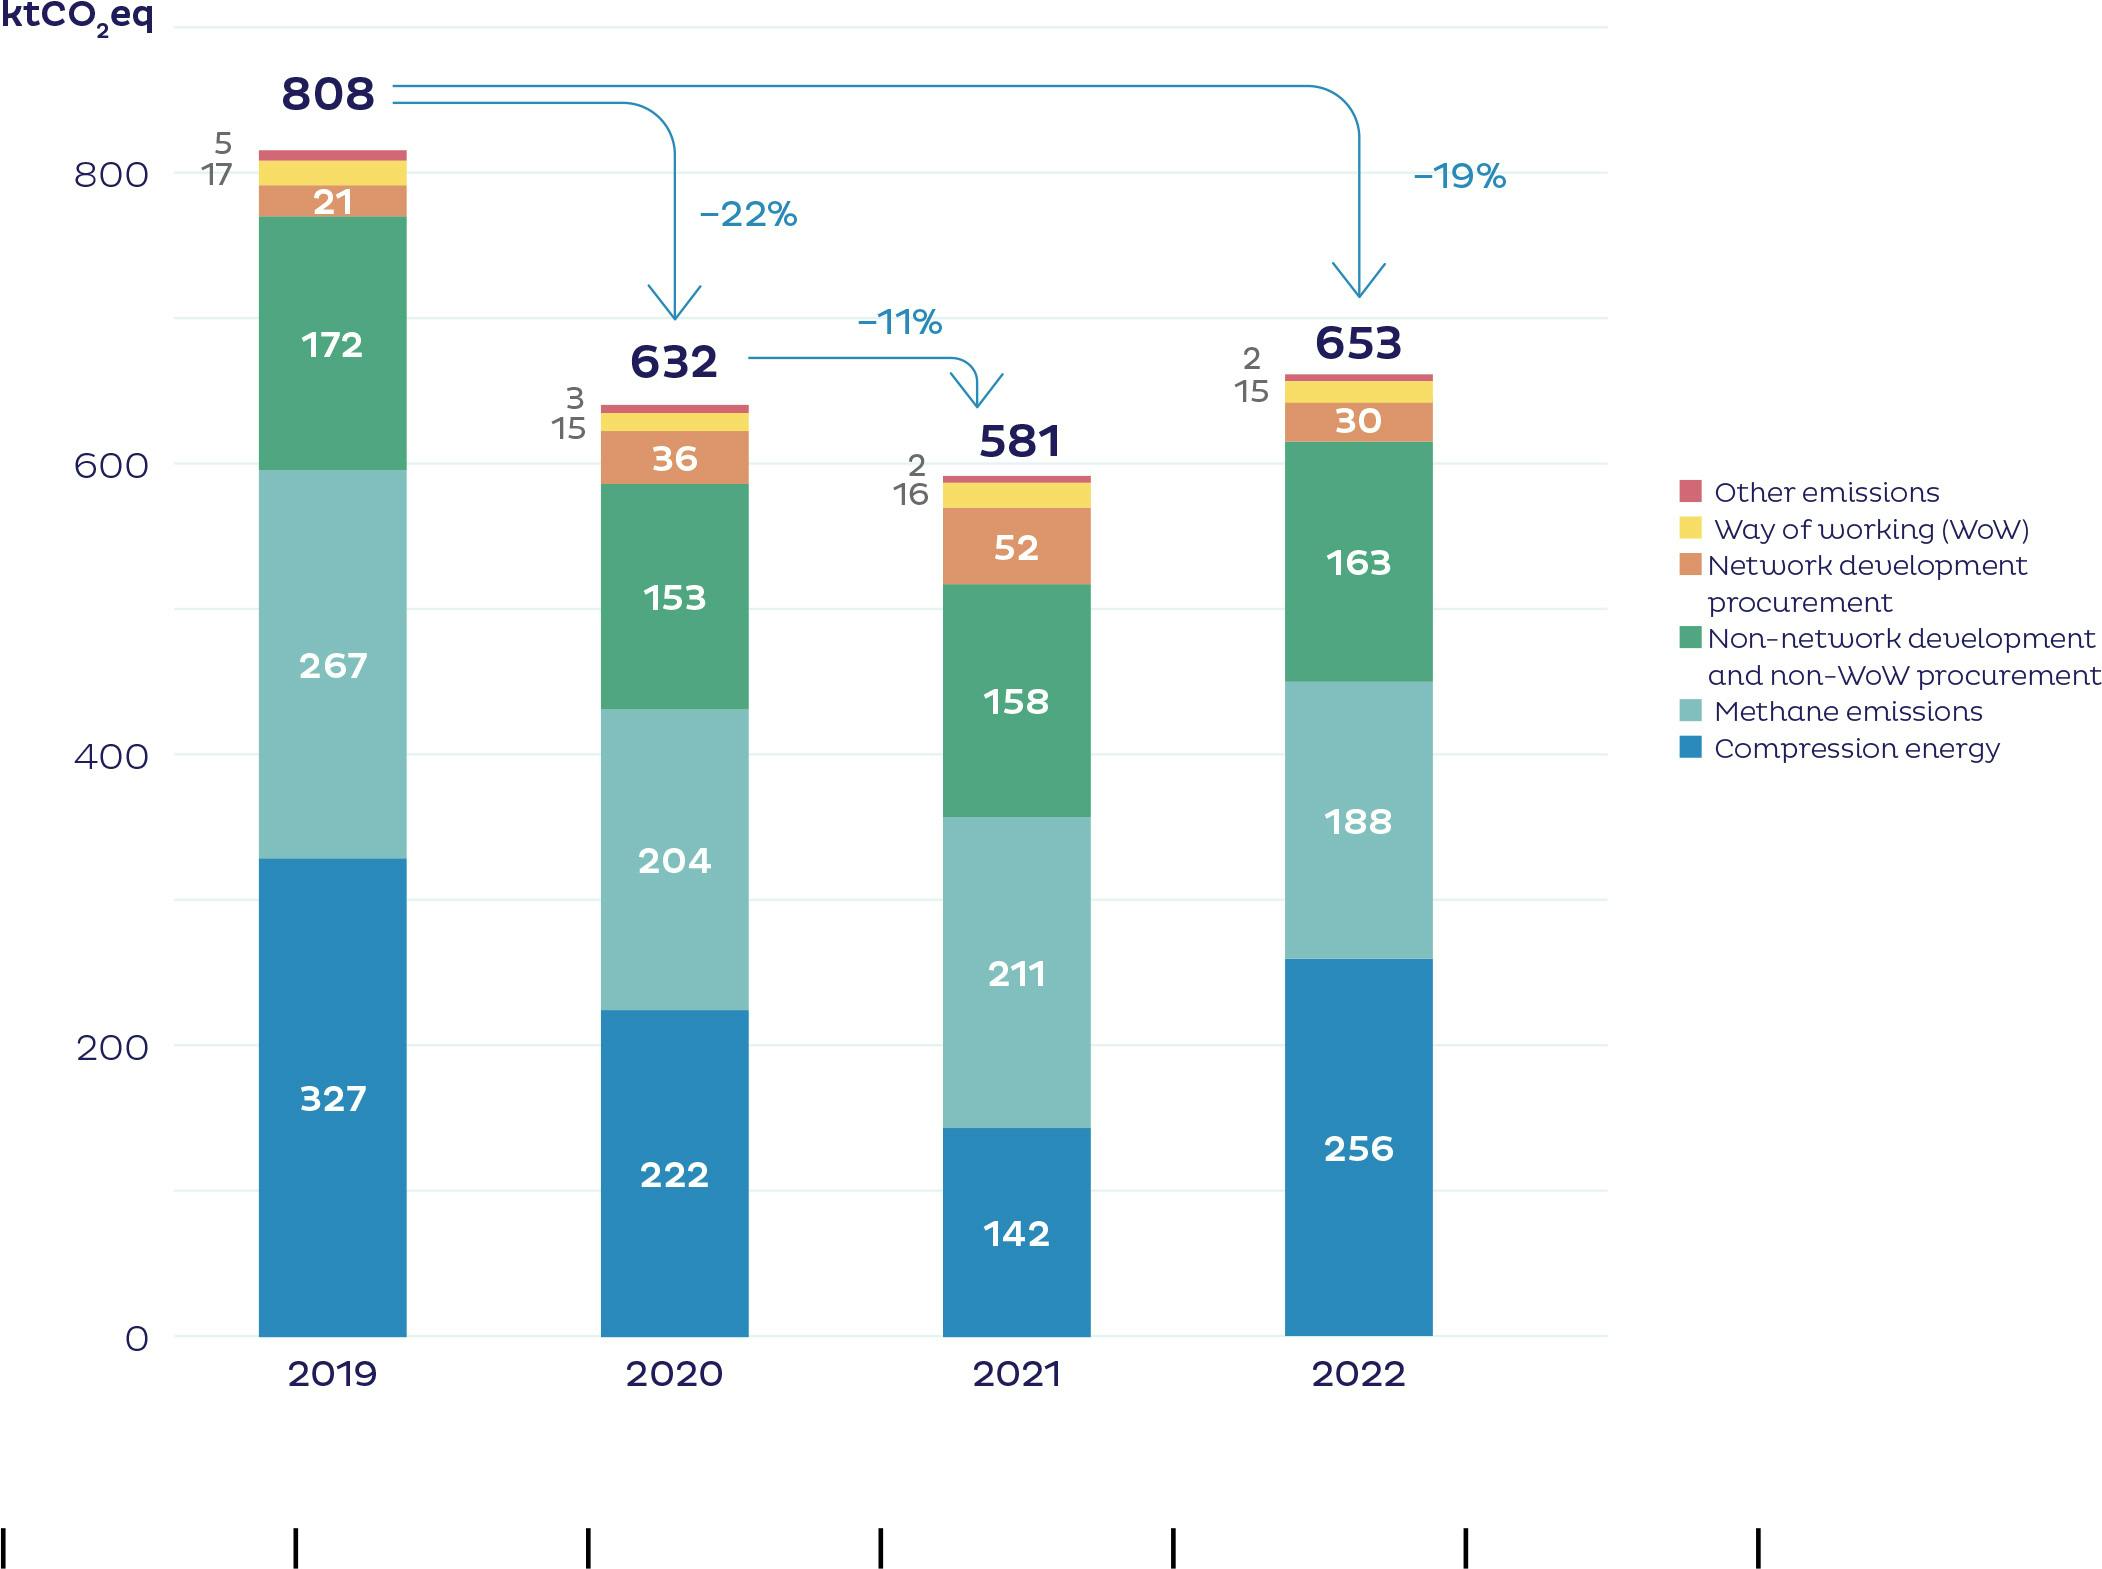
PROGRESSION OF EMISSIONS WITHIN THE MANAGEABLE SCOPE OF GRTgaz
(Scopes 1, 2 and 3 excluding upstream and final use of transported gas)

This graph shows the progression of emissions within the manageable scope of GRTgaz. (scopes 1, 2 and 3 excluding upstream and final use of transported gas)
Compression energy
- 2019: 327 KtCO2eq
- 2020: 222 KtCO2eq
- 2021: 142 KtCO2eq
- 2022: 256 KtCO2eq
Methane emissions
- 2019: 267 KtCO2eq
- 2020: 204 KtCO2eq
- 2021: 211 KtCO2eq
- 2022: 188 KtCO2eq
Non-network development and non-WoW procurement
- 2019: 172 KtCO2eq
- 2020: 153 KtCO2eq
- 2021: 158 KtCO2eq
- 2022: 163 KtCO2eq
Network development procurement
- 2019: 21 KtCO2eq
- 2020: 36 KtCO2eq
- 2021: 52 KtCO2eq
- 2022: 30 KtCO2eq
Way of working (WoW)
- 2019: 17 KtCO2eq
- 2020: 15 KtCO2eq
- 2021: 16 KtCO2eq
- 2022: 15 KtCO2eq
Other emissions
- 2019: 5 KtCO2eq
- 2020: 3 KtCO2eq
- 2021: 2 KtCO2eq
- 2022: 2 KtCO2eq
Total
- 2019: 808 KtCO2eq
- 2020: 632 KtCO2eq
- 2021: 581 KtCO2eq
- 2022: 653 KtCO2eq
There was a drop of 22% in 2020, 11% in 2021 and 19% in 2022.
